Exploring and Predicting Rail Occurrences in Canada
Overview
This project explores and analyzes over two decades of Canadian rail incident data to identify trends, risk factors, and patterns across provinces and incident types. The goal was to build an interactive dashboard and apply predictive modeling to forecast potential high-risk areas.
Key Highlights
- - Used Python (Pandas, Seaborn) to clean and analyze Transport Canada rail data
- - Built an interactive Tableau dashboard to visualize incident trends by location, cause, and type
- - Applied Random Forest and XGBoost to classify high-risk zones with accuracy
- - Mapped occurrences using Folium & GeoJSON overlays
Interactive Tableau Dashboard

Python Visualizations
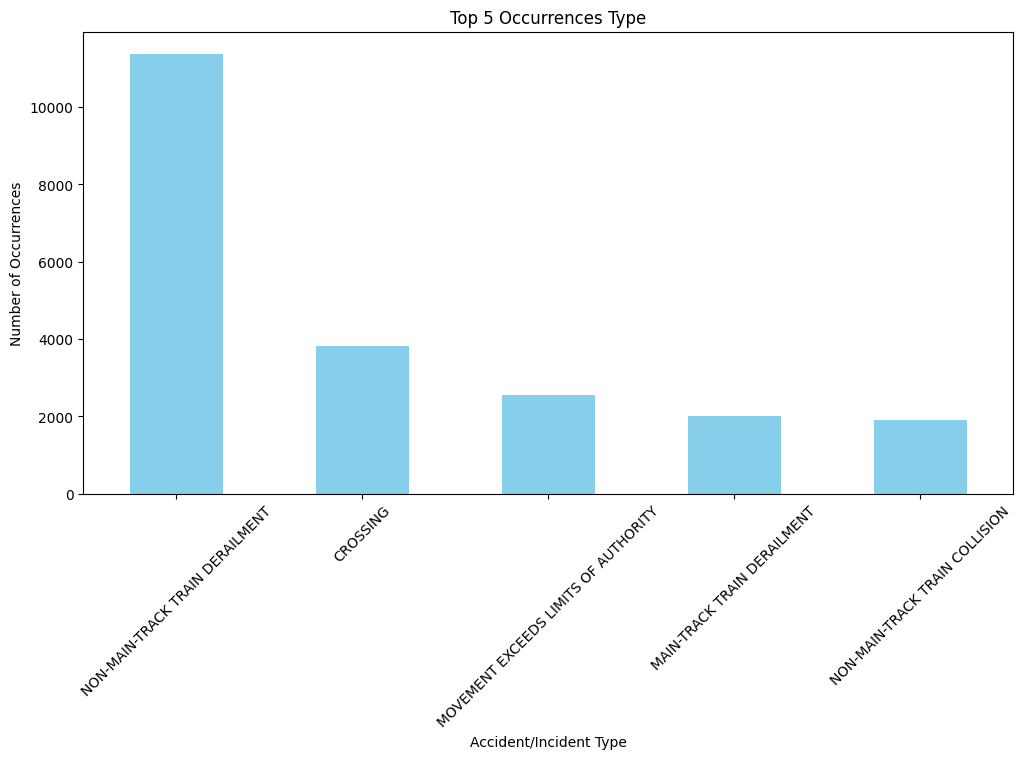
This chart highlights the most frequent types of railway occurrences across Canada, emphasizing derailments and crossings as key safety concerns.
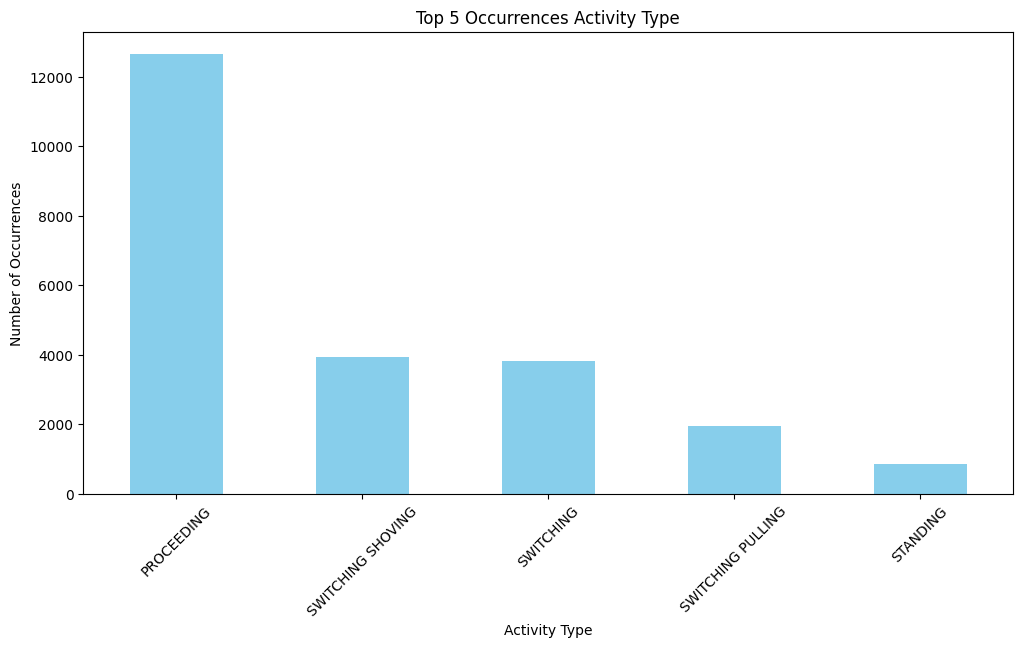
Shows the top activities during which incidents occurred, with 'Proceeding' being the most incident-prone operational state.
Interactive Folium Map
Explore clusters of incidents by region across Canada using this interactive marker map.
Explainable AI (XAI) Analysis
To improve model interpretability and trust in predictive insights, we applied Explainable AI (XAI) techniques. In this project, I have used LIME (Local Interpretable Model-Agnostic Explanations) to interpret predictions from the best-performing classifier (XGBoost).
Why XAI?
Traditional machine learning models like XGBoost and Random Forests can achieve high predictive accuracy but act as "black boxes"—making it difficult to understand why a certain prediction was made. This is critical in safety analysis and risk prediction tasks where transparency supports better decision-making.
How We Applied XAI
LIME was used to explain individual predictions made by the XGBoost model. For a selected validation sample, LIME perturbs the input data and observes the impact on prediction probabilities. This helps identify which features contributed most to the prediction of a specific class (e.g., high-risk zone).
Results & Interpretation
The result below shows a breakdown of feature contributions for a single instance prediction. Positive values indicate features that pushed the prediction toward a certain class, while negative values pulled it away.

As shown above, variables such as Region, Occurrence Type, and Activity Type played key roles in classifying an incident into a higher risk category. These insights help explain why the model predicts a specific outcome—making the system more interpretable and justifiable.
Model Evaluation Results
As part of the injury classification analysis, several machine learning models were trained and evaluated based on performance and runtime. GridSearchCV was used for hyperparameter tuning.
| Pipeline | Duration | Metric | Best Params |
|---|---|---|---|
| Logistic Regression | 00:00:03 | 0.835 | {'C': 0.1} |
| Random Forest | 00:00:17 | 0.925 | {'max_depth': 20, 'n_estimators': 50} |
| XGBoost | 00:00:01 | 0.9346 | {'learning_rate': 0.01, 'n_estimators': 50} |
| KNN | 00:00:12 | 0.844 | {'n_neighbors': 3} |
| Decision Tree | 00:00:00 | 0.933 | {'max_depth': 5} |
Best Metric: 0.9346 achieved by XGBoost.
Tools & Libraries Used
- Python (Pandas, NumPy, Matplotlib, Seaborn)
- Tableau (Interactive dashboard)
- Folium (Geospatial mapping)
- Scikit-learn, XGBoost
- LIME (Explainable AI)